SPX · SPY · QQQ
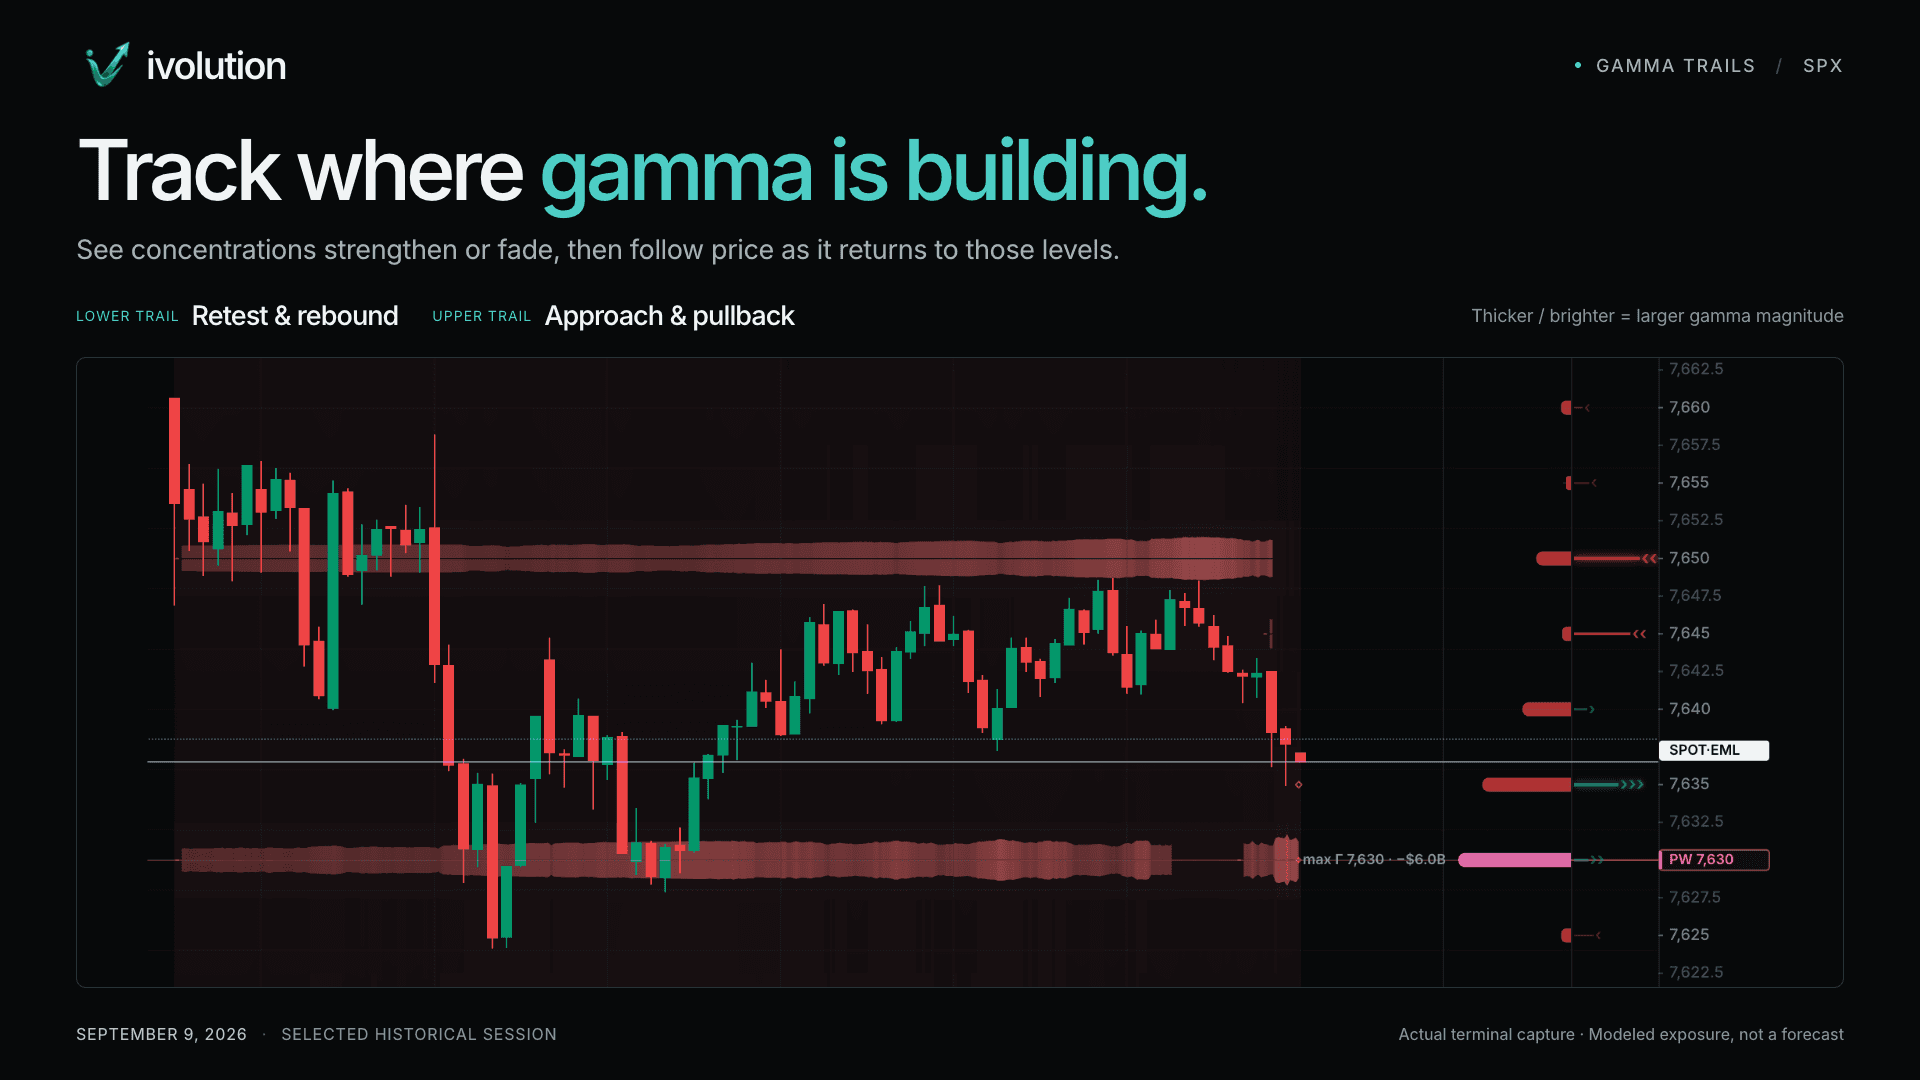
See SPX gamma exposure alongside price.
Compare modeled gamma exposure with your existing SPX analysis. Inspect a real historical Terminal chart below, then review the monthly plan.
For traders who already have a process
Use the Terminal to inspect positioning, compare market context, and review the inputs behind the analytics. You make the trading decisions.
- Dealer positioning: GEX and related modeled exposure for SPX, SPY and QQQ.
- Flow context: options and equity flow analytics alongside your existing analysis.
- Product status: Terminal is in beta. This plan does not include the AI layer.
- Indicator access: included TradingView indicators require manual provisioning. Separate platform or exchange subscriptions may be needed.
For NQ workflows, the current After Hours GEX book is a frozen dated reference. It is not a live NQ feed.
Read the product guideLoading the current monthly plan…
Whop handles checkout and displays the price, renewal terms, and cancellation details before payment. Ad measurement is optional and does not affect access or pricing.